So just how good are you?
Host: Katherine Research Station
Written by Jodie Ward – Pastoral Production Extension Officer, Katherine Research Station.
First of all, I have to say, I cannot take any credit for the work I’m about to describe to you as I personally had very little to do with it – however other members of the team I work with did and I think that the work they completed is particularly Central Station ‘blog-worthy’.
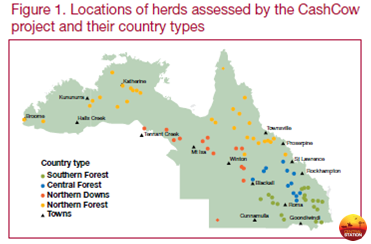
No doubt you keep records that you create percentages or rates from to allow yourself to keep track of how your business is performing from one year to the next, such as pregnancy rate or weaning rate, but do you what level of performance is attainable in your region? Well, the CashCow Project (aka Northern Australian beef fertility project) developed by the beef industry’s finest research scientists followed 78,000 cows in 142 breeder mobs for three to four years right across northern Australia. By doing so, the project team were able to describe the reproductive performance of breeding enterprises using four country types that represented the major beef producing regions of northern Australia.
Why is this important you may ask? So we can compare apples to apples for every other production measurement between herds and describe attainable levels for industry performance in areas that are similar to each other. For example, the production capacity of country on the Barkly Tablelands near Tennant Creek is similar to that of the Mitchell grass plains near Winton, therefore providing an opportunity for a producer to understand the production performance of the “top 25%” in their region, and then undertake their own cost benefit of changes they could make to achieve this, and the effect it would have on business profitability.
‘What sort of changes?’ I hear you ask . . . Well, settle down good friends, good things come to those who wait.
By following so many cows for that period of time, the project team not only found that there can be a massive difference between those properties performing best and those that are not doing so well, but also that there are common management strategies that could be employed to help those at the bottom move towards the top of the production ladder.
What am I talking about you may ask? Well for example, the project team found that in the Northern Forest region (see the map), the 25% best performing producers are achieving 18% pregnancy in first lactation females within four months, while the 25% least performing producers are only getting 6%.
‘So how do we influence that?’ I hear you ask in frustrated italics – ‘Hold your horses I say’!
Then, if we think about that difference in production (18% versus 6% pregnancy in first lactation heifers) – imagine how that might influence the future productivity of the herd if we know that it is essential to set heifers up appropriately to provide them the best opportunity to perform to their genetic ability, and at any one time heifers can represent up to 30% of the breeding herd, depending on the culling policy!
In association with appropriate cost benefit analyses, we have the potential to make gains people!
‘BY USING WHAT STRATEGY???’ Yeah, alright, no need for shouty capitals . . . Goodness me.
But this is only one example, there is a whole range of measurements that beef businesses can reference current performance to, and better yet, the project team put together two easy-to-read documents that are available for free online that not only describe how to measure these production measures, but influencing factors that might help as well.
There you go. Happy now?
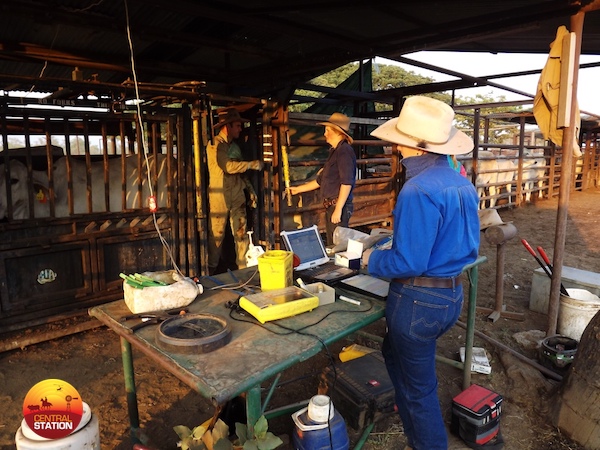
The first document is “Could your herd be more productive?” which is downloadable for free (only 756KB) from here. This excellent eight page document starts with how to critically evaluate your herd and then moves onto describing the potential methods of improving your herd’s productivity. It also identifies the crucial data to record when processing your cows to ensure you collect the right data to enable you to accurately compare your benchmarks with the data captured during the CashCow project. How good is that? All in only eight pages!
And then the recorded data itself can be found in the “Technical Synopsis: CashCow findings” which can also be downloaded for free from here (7.46MB).
So, if you were thinking that you were good, but wondering just how good in comparison to others of similar country types, be sure to check out these two documents – it could mean the difference between average performance and extraordinary performance for your business.